How Do I Navigate, Understand, and Use My Dashboard Data?
The Implementation Dashboard captures data twice a year using school system leadership and school leadership self-assessments and teacher observations. It shows the overall strength of implementation and trends by key action, and it provides a to-do list of actions to take to progress to the next phase. The data helps you identify trends at the school system, school, and classroom levels to inform implementation plans.
On this page, you will…
Understand how to use data in the Implementation Dashboard to plan your next steps to support implementation.
Access resources to understand how scores are calculated in the Implementation Dashboard.
Navigating the Dashboard Demo
Using Implementation Dashboard Data to Plan Next Steps

Once your Implementation Dashboard is ready, it’s time to dig into your results and plan your next steps. We recommend meeting as an implementation team and starting with an overall discussion of your data using the following questions:
- Are you surprised by your progress in your phase of implementation? Why or why not?
- What are the overall implementation strengths? How can you continue to build on them?
- For key actions you scored as yellow or red, what do you think contributes to this score?
Once you’ve discussed the overall strength of your implementation, it’s time to create a plan to support your progress to the next phase.
- Review each key action scored as yellow or red and identify the highest-priority success criteria. Don’t feel that you need to tackle it all at once; focusing on a few at a time is okay.
- Include how you can support any high-priority success criteria for each relevant group. For example, if you are part of school system leadership, include the support you will provide to school leadership and teachers.
- Your plan should include the required next steps, an owner, and a due date. The sample plans linked below can serve as a guide.
Where Does the Implementation Dashboard Data Come From?
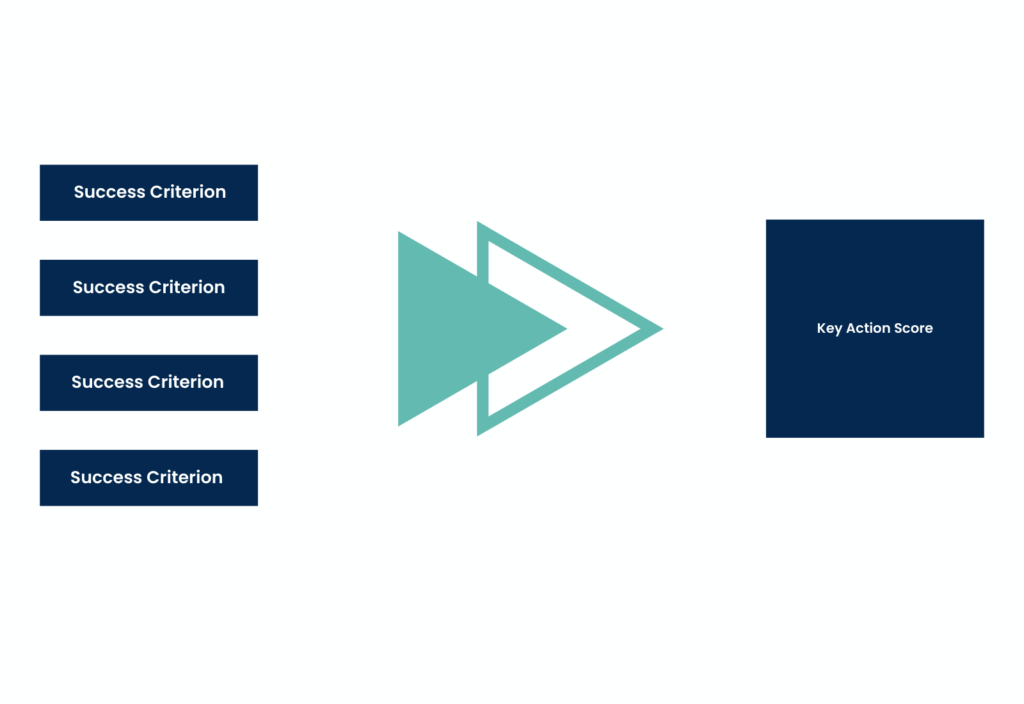
School system leadership and school leadership self-report progress at the system level or school level against success criteria corresponding with the key actions for their current implementation phase. These responses generate key action scores for school system leadership, school leadership, and teachers. The key action scores are then rolled up to provide an overall implementation score at the school system and school levels.
The Implementation Dashboard assigns a green, yellow, or red score at the key action, school, and school system levels, based on the total number of points possible for all success criteria. The scores break down as follows:
Green scores
Means on track. The key action, school, or school system earned 85% to 100% of the total possible success criteria points.
Yellow scores
Means slightly off track or in a new phase. The key action, school, or school system earned 60% to 84% of the total possible success criteria points.
Red scores
Means off track or in the early implementation of a new phase. The key action, school, or school system earned less than 60% of the total possible success criteria points.